

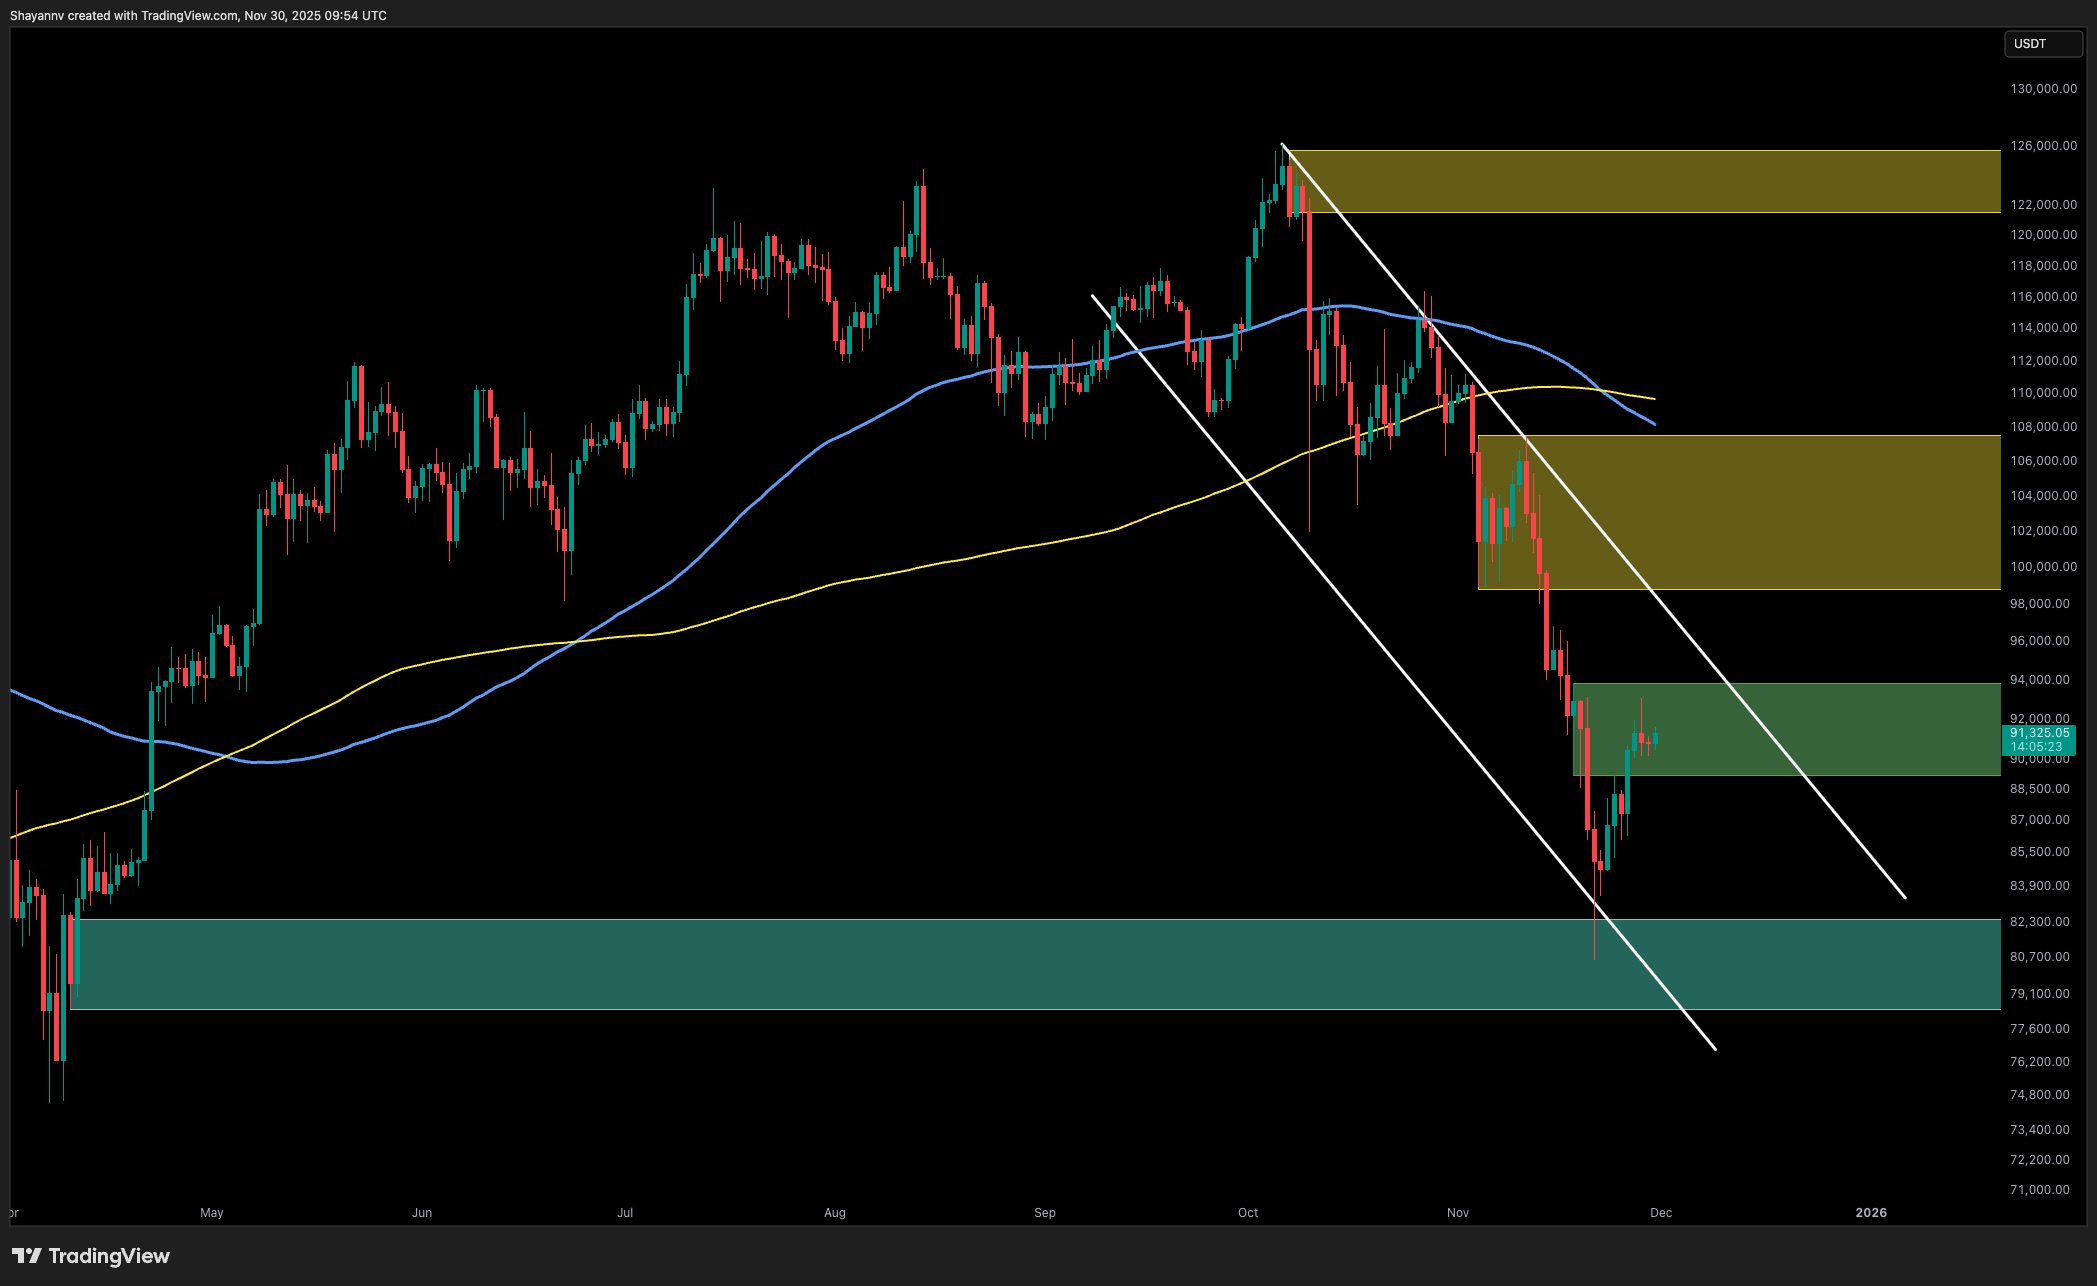
Bitcoin attempts to reverse its recent bearish sentiment, bouncing sharply from the $80K–$83K support zone. However, the cryptocurrency faces strong resistance near the $91K–$93K range, which has stalled its upward momentum on the daily chart.
Technically, Bitcoin remains within a descending channel on the daily timeframe, with the 100-day and 200-day moving averages acting as overhead resistance. According to market analyst Shayan, a decisive reclaim of the $103K–$106K zone is needed to invalidate the current bearish trend and signal a stronger upward move.
Key Resistance and Support Levels
- Immediate resistance: $91K–$93K supply block and descending trendline.
- Strong support: $80K–$83K demand zone.
- Macro resistance zone: $103K–$106K area for trend reversal confirmation.
The 4-hour chart highlights a critical decision point. If Bitcoin fails to break above $93K, the price may retrace back toward $86K–$88K, with deeper support at the $80K–$83K zone. On the other hand, closing above $93K could open a path to the $102K–$106K inefficiency zone, where the next major market reaction is expected.
On-Chain Resistance Insights
On-chain data reveals a significant resistance layer slightly above technical levels around $96K–$97K. This is driven by the combined average cost basis of two key investor groups: recent 1-week to 1-month buyers and 6-month to 12-month medium-term holders. Their realized price convergence creates a psychological barrier and substantial sell-side pressure as these cohorts attempt to break even.
Market watchers highlight that to overcome this resistance, Bitcoin requires a firm daily close above $97K. Such a move would suggest that selling pressure from these holders has been absorbed, potentially paving the way for higher price levels.
Currently, Bitcoin stands at a critical crossroads that will determine whether its recent bounce develops into a sustained retracement or a continuation of the broader downtrend. Traders and investors will closely monitor price action around these resistance zones in the coming weeks to gauge the digital asset’s next major directional move.